NGC 1275 is the elliptical galaxy at the center of the Perseus cluster. It also displays one of the most extended filamentary structure of ionised gas.
NGC 1275 is therefore a target of interest allowing us to study the phenomena at the origin of these filaments. It also gives us insights on the influence the supermassive black hole at its core could have on shaping these structures.
Low spectral resolution (R=1800) observations of NGC 1275 were already obtained and analyzed by Dr. Marie-Lou Gendron-Marsolais in 2017 to decipher the possible origins and evolution of the gaseous filaments as well as the dynamics of the system as a whole.
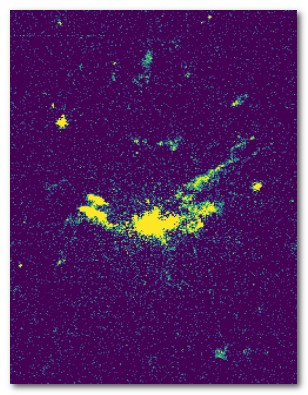
As a first introduction to the observational data of this galaxy, I reproduced some of the velocity maps for specific wavelengths with the same analysis method as Dr. Gendron-Marsolais. (See Fig. 1)
The main objective of my research will be to reproduce this analysis for the new high spectral resolution (R=7000) observations of NGC 1275.
Fig. 1 - Velocity Map of the Hα line for the low resolution data.
Observations of NGC 1275
The high spectral resolution observations of NGC 1275 were acquired in 2019 with the SITELLE instrument installed at CFHT.
SITELLE is a Fourier Transform imaging spectrometer which produces hyperspectral cubes of a specific region of the sky. By using these cubes, we are able to observe the region through several wavelengths but also to recover the spectra associated with each pixels of the image.
This instrument was previously chosen to perform the low resolution observations of the galaxy because its wide field of view is the only one capable of imaging the gaseous filamentary structure in its entirety.
The first low spectral resolution observations of NGC 1275 revealed several key features of the velocity structure, some of which were correlated to previous X-ray and radio observations.
These observations were therefore of great use to obtain the mapping of the entire velocity structure of the filamentary nebulae. However, the low resolution proved itself to be unoptimal in order to perform an accurate analysis of the velocity components.
Therefore, high resolution observations were needed to resolve clearly the emission lines but also disentangle the sky lines that contaminates the observational data.
Nevertheless, with a resolution this high, the analysis becomes more complex, because more features will be distinguishable, therefore, they need specific attention to be accounted for.
Analysis of High Resolution Data
The analysis of the observational data at high resolution will be similar to the one at low resolution. But, since more features will be resolved, this analysis need to be pursued with specific care.
The spectrum produced by SITELLE use a Fourier transformation based on a sinc function, which shows specific lobes around the central peak.
In the case of low resolution data, these lobes would not be resolved clearly. With high resolution data, however, they are, as shown by the comparison of the spectrum extracted from the same region of the filament system for both low and high resolution presented in Fig. 2.
Fig. 2 - Comparison of the spectrum extracted from the same region of the filament system for both low (blue line) and high (orange line) resolution.
Most of the spectral emission is contained within the lobes, therefore, for each wavelengths of interest, we need to pursue a careful analysis in order to distinguish the elements belonging to different lines.
Indeed, if they are close to one another, like in the case of the Hα line, the lobes might overlap. For low resolution they were not resolved so they could be assimilated as a singular feature.
Future Techniques of Analysis
We are currently working on a novel technique for the analysis of such data by combining both Bayesian approach and Machine Learning.
Bayes' Equation
We will use Bayesian Inference to determine the optimal number of line-of-sight (LOS) components.
By using dynamic nested sampling techniques, we are able to calculate the Bayesian evidence and use it as a proxy for goodness-of-fit.
This will allow direct comparison between a single LOS component and multiple LOS components.
Additionally, we will be employing a convolutional neural network currently under development in our lab to validate these results (see Fig. 3).
Fig. 3 - Convolutionnal Neural Network Diagram
Moreover, by looking at the recovered high resolution flux for the Hα line, we can clearly see that a careful analysis will be necessary to disentangle the background sky lines from the actual emission (see Fig. 4).